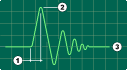
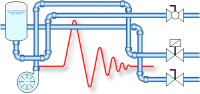
The impulsive overpressures said "water hammer" manifest themselves when the fluid is accelerated or braked sharply.
Depending on the time for intervention of the valve, on the fluid and on the pipe characteristics, a pressure wave diffuses itself in the same pipe, causing extra stresses for all the components.
The hydraulic systems, both automatics and manuals, are continuosly subject to this phenomen which should be considered in design phase to avoid the break or usury of the interested components.
Fluid type selection
Fluid density at 20°C
kg/l
Elastic modulus
GPa
Pipe dimension
Chosen pipe dimensions
Øe (mm)
Øi (mm)
Selection pipe material
Ultimate strength Rm
N/mm2
Elastic modulus E
N/mm2
Notes of parameters considered with the safety factor:
The global safety factor 3.7 considers:
The global safety factor 4.2 considers:
Global safety factor
x
Pipe length
m
Time for intervention of the valves:
s
Typical values for solenoid valves CETOP 3-5.
Typical values for solenoid valves CETOP 7-8-10.
Fluid velocity (v):
m/s
Typical velocity values used in hydraulic (oleodynamic) systems.
Max system pressure:
kg/cm2
Setting pressure of the valve of max pressure.
| Results | |||
| Peak overpressure (water hammer) | kg/cm2 | ||
| Peak pressure | kg/cm2 | ||
| Shock wave velocity | m/s | ||
| Critical period (phase time) Tf | s | ||
| Pipe thickness choosen | mm | ||
| Minimum thickness required | mm | ||
Max overpressure.
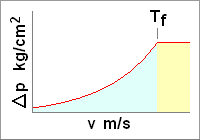 In this graph we can see the trend of the peak overpressure (Delta P) related to
the time of intervention of the valve (v m/s), below the phase time
(Tf) the overpressure doesn't increase.
In this graph we can see the trend of the peak overpressure (Delta P) related to
the time of intervention of the valve (v m/s), below the phase time
(Tf) the overpressure doesn't increase.
The phase time is related to the shock wave velocity that is influenced by the temperature
of the pipe and of the fluid (their elastic modules change), in this calculation the
temperature is considered of 20°C.
Peak pressure.
The peak pressure is the max work pressure of the system summed to the peak overpressure
calculated.
Reduction of the peak.
For some kind of circuits, such as for the intake manifolds, is possible to reduce the peaks
adding some dumper springs for dissipate the stored energy.
The apps about pressure peaks.